
Your Yolo County and Sacramento Market Report
- REGINALD POWELL
- Mar 15, 2023
- 3 min read


Its all about the data!
It’s been a while since I sent out the market report. I’m a numbers guy, but I know not everyone wants to see a bunch of sales data. This email, however, is for everyone who likes that data. I will also start sending this out monthly, to keep you all informed of the market trends. This information is specific to the cities in my surrounding area, but I am sure these trends are happening in other markets as well. Inventory has continued to decline, making it competitive again for buyers. Looking at the chart, you may be thinking that homes are sitting on the market for a long time. And in some cases, that would be correct. There are still agents and sellers out there who are overpricing their homes. They are still living in spring 2022. But, this is 2023. A lot has happened since then. This market is different from last year. The sellers and agents that price their homes correctly are getting multiple offers in and accepting an offer within a week of the house going up for sale. I am working with a few buyers right now and we are seeing offers being accepted within days of the house being listed for sale. This market is actually a healthier market than what we had seen last year. Now, as a buyer, you don’t need to bid $300,000 over ask and remove all contingencies to get a home. You don’t need to buy anything without inspections being done. As a buyer, you can get better terms. The prices have come down a bit and you can write an offer again with a 10-17 day inspection period, to make sure there are no big issues before making what could potentially be the biggest purchase in your life. If you are a buyer, it is a great time to get back out and find a home. Interest rates are higher, but you can always refinance. Also, a 5-6% rate really isn’t that bad. Especially when you compare it to paying rent, which is the same as paying 100% and not having anything at the end of the day. Below are sales charts for Woodland, Davis, Sacramento, Winters, and West Sacramento. These charts just show homes for sale, sold, and pending. If you want more information, I can send you more information specific to your neighborhood.
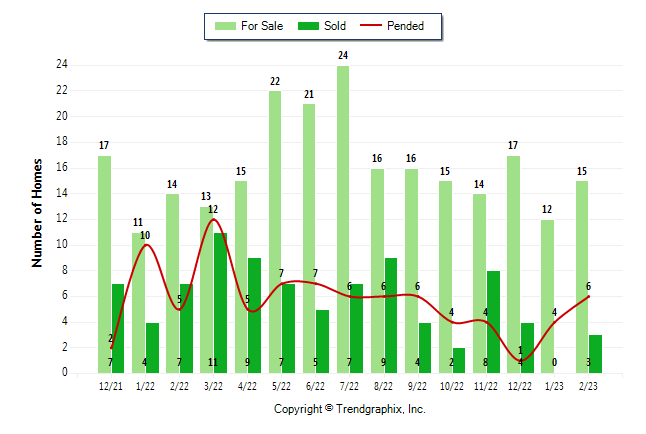
Woodland
The delta between homes for sale versus homes sold is shrinking. There is not a whole lot of inventory to choose from right now. Looking at last month, there were 301 homes for sale and 30 sold.
Davis

In Davis we are seeing the same thing. Sales are increasing yet inventory is decreasing.
Winters
Winters is seeing more inventory hit the market while sales have stayed about the same.
West Sacramento

West Sacramento is seeing a decrease in inventory as well. From What I am seeing with clients, I expect the sales volume to have increased on this chart by next month.
Sacramento
Sacramento has a huge drop in inventory since last July while sales are starting to tick up as well.
There is a lot more data I can share with you, but I don’t want to overwhelm you with all the numbers. If you have any questions about your neighborhood specifically, give me a call and we can look at that as well. If you have any questions about what all of this means, please feel free to call me.


Comments